No Good Options
11 March 2020
Originally posted on medium.com
Tl;dr:
-
Reported cases of COVID-19 in the US dramatically understate the current number of infected Americans.
-
The current US mortality rate is likely much lower than reported (~0.4%).
-
Asymptomatic and mild cases are hard to detect and make this disease incredibly difficult to contain.
-
Without strong government intervention to slow the spread, the disease could spread to millions of Americans in very little time. This would overwhelm hospitals and increase the mortality rate of the disease.
-
Federal, state, and local governments will be forced to take unprecedented steps to slow the spread of the virus, including quarantines, school and business closures, and domestic travel restrictions. While there will be significant economic fallout from these measures, the damage to the country and economy would be worse without them.
-
Most of the economic costs of the government response will fall to lower and middle income wage workers. Policies, such as enhanced unemployment insurance, should be adopted quickly to compensate these workers for the sacrifices made in the best interest of the country.
-
Policymakers should also implement smart economic policies that will slow the spread of the virus in order to protect the public. Requiring paid sick leave and guaranteed healthcare will slow the spread and economic consequences of COVID-19. Quick note from the author
Disclaimer. I am writing this on my own behalf to try to increase transparency and information about the seriousness of the situation we’re facing. The views and work contained in this note are purely my own and represent no one else and no organization or company.
*My Background. *Please note that I have no formal training in epidemiology. My background is in economic research, financial policy, and data science. I have worked in the US Federal Government in various research positions for six years and in the private sector for almost seven years. I specialize in policy, data science, and forecasting.
*Why I Wrote This. *Due to high levels of uncertainty around the virus, I am writing this note to provide a broad sense of the scale of the crisis the country is facing. Any forecasts or estimates in this note should be taken as my best educated guess based on publicly available data and models. I am open to all comments and constructive criticism of my analyses and models.
What is reported to be happening right now?
Global Reported Cases
You may have seen this map. It was put together by some very clever researchers from Johns Hopkins University. Their dashboard is being used by researchers and policymakers around the globe. The datasets from my analysis comes from them and I am grateful for their work in keeping the data public and up-to-date.
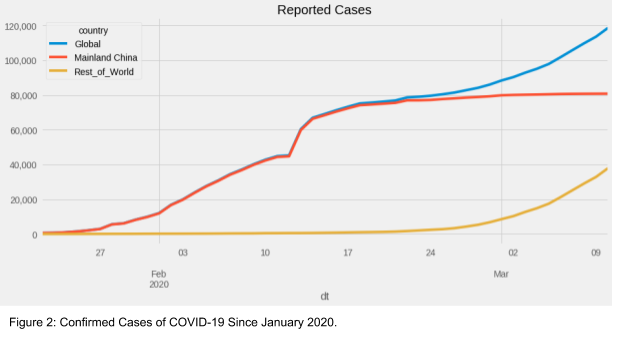
As of writing this, the world has over 100,000 confirmed cases of the novel coronavirus disease, COVID-19. Most of the cases are still in China, but that picture is changing rapidly. As recently as two weeks ago (Feb 23), China’s cases represented >97% of global cases. As of March 10, that number has dropped to 68%. It is becoming clear that the rest of the world will soon surpass China’s infection count.
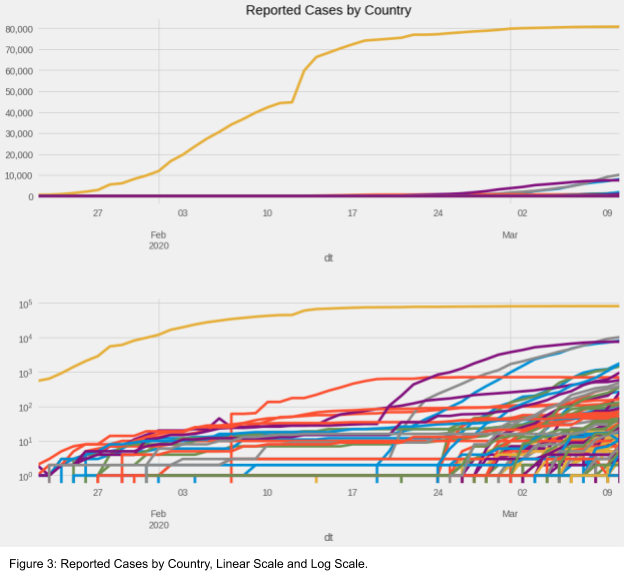
You’ve probably also heard that Italy and Iran have significant outbreaks of their own. Indeed, they have the second and third most cases after China at 10,149 and 8,042, respectively, at the time of writing. You can see both countries as the gray and blue lines in the top chart of Figure 3. Certainly the situation in those countries is concerning, but equally concerning is how quickly other countries are seeing their case count take off. That is more apparent when you look at individual countries on a log scale, as you can see in the bottom chart of Figure 3. This log scale just means that each tick mark represents 10x as much as the previous tick mark. The lines in both charts are the exact same data. Each line represents one country’s total number of cases from the beginning of the outbreak.
The characteristics of the novel coronavirus: Severity & Spread
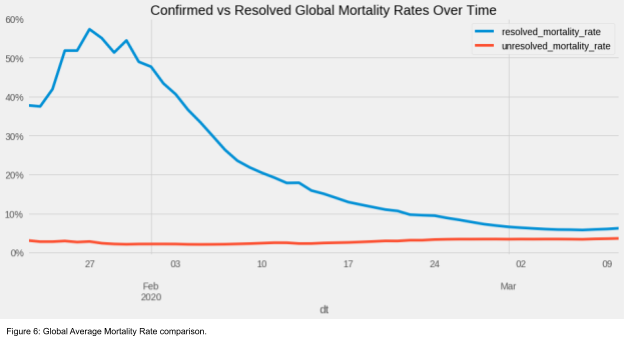
The mortality rate is defined as deaths from COVID-19 / cases of COVID-19. The estimate for the denominator matters a great deal. Here are two commonly cited versions:
-
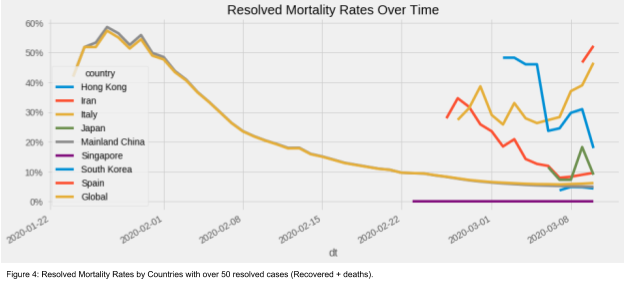
Resolved mortality rate. This rate uses the total of all resolved cases as the denominator. In other words: deaths / (recovered cases + deaths). This should be regarded as the upper bound and even then is probably much too high. Deaths are more likely to be detected as being attributable to COVID-19 than are recovered cases, thus heavily biasing the estimator.
-
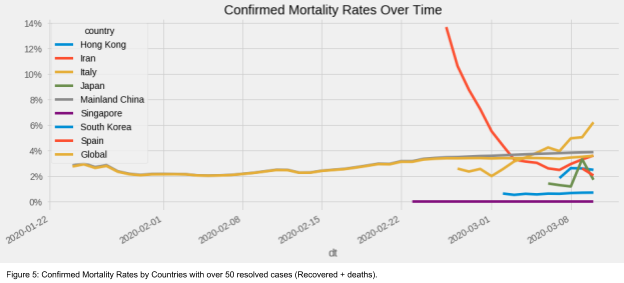
Confirmed mortality rate. This rate uses the cumulative total of all reported cases as the denominator. In other words, deaths / reported cases. This one is likely closer, however there are still several sources of bias. One bias comes from the fact that some cases are not yet reported, which would likely overstate the estimate. Another bias comes from including seriously ill people who may die in the future, which would understate the estimate.
As more people recover and are identified as having mild (or no) symptoms, the resolved mortality rate tends to decline over time. That can be seen most clearly in China, which is hovering around 5% RMR. Singapore has done an especially good job at minimizing the impact of COVID-19 with a staggering 0% mortality rate. Other countries in the chart should expect their resolved mortality rates to decline, as China’s has. The worst cases are frequently the first cases identified in the country and thus account for a higher rate at the beginning of an outbreak.
Confirmed mortality rates are the rates normally quoted in the media. They can also overstate the “real” mortality rate because the worst cases are more quickly detected. As I will explain later, the novel coronavirus likely has an asymptomatic rate of 17–30%. As a result, even the confirmed mortality rates likely overstate the “real” probability of dying from COVID-19.
We should expect that, over time, that the two mortality rates will converge to roughly the same level. We are beginning to see that happen around 3.6%. Again, there are reasons to believe that this number is still higher than reality because of undetected asymptomatic and mild cases. We will make adjustments for that next.
What is ACTUALLY going on?
The first section was about presenting the best information as reported by public health officials. Unfortunately, public health officials haven’t tested every person on the planet. So, we need to estimate (1) what the true number of cases would be with comprehensive testing and (2) how better case estimates would affect the rates I wrote about above. Two key factors may drive miscounting of the number of cases:
-
**Asymptomatic and mild cases. **These are people who show no obvious symptoms of COVID-19 or whose symptoms are mild enough to not warrant a trip to be tested. In fact, in the US until a week ago, many people with symptoms were not even allowed to get a test! As I write this, many Americans do not have access to tests because of supply constraints. The Federal and state governments have pledged to fix this quickly. I hope they do.
-
**Detection rates. **This is how frequently public health authorities can positively identify someone with COVID-19. Detection capabilities vary by country because of variation in the quality of the healthcare systems. Detection rates also probably vary based on the severity of the symptoms.
Estimating the Impact of Asymptomatic Cases
There have been many attempts to identify the proportion of COVID-19 cases that show no symptoms. The best estimate I could find came from the unfortunate passengers of Japan’s Diamond Princess cruise. Two academic studies put the asymptomatic rate between 17% and 30%. For this analysis, let’s start by assuming an asymptomatic rate of 30%, at the high end of this range. This is a reasonable decision because of the older population on the cruise. Older people have tended to show more severe symptoms than younger people and they may be more likely to show symptoms than the general population. As a result, the studies based on the cruise may be understating the true asymptomatic rate for the general population.
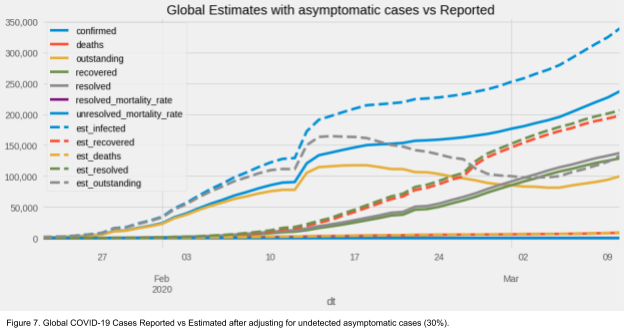
So, if we assume that these asymptomatic cases are largely going without detection and proceeding to recovery without a problem, we can adjust our earlier case estimates.
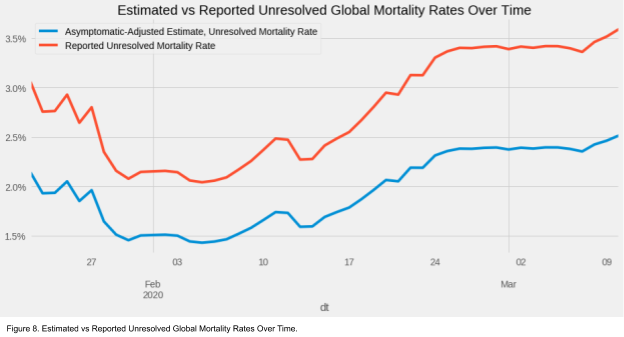
These new estimates allow us to revise our mortality rate calculations.
The blue line (lower line) in Figure 8 reflects the fact that we added more cases without adding more deaths. This is good news! Although, the increase in the mortality rate after mid February is a bit unsettling. This trend is largely driven by China’s reported cases and deaths.
China’s recent numbers: What we know and what we don’t
A broad consensus has emerged that Wuhan in the Hubei Province of China was the epicenter for the beginning of the COVID-19 outbreak. Several media accounts have reported that the initial governmental response was slow and inadequate to the public need. The central Chinese government made strong changes to the country’s approach to the disease starting in late January. Generally, many policymakers have looked favorably at China’s recent policy response to the outbreak, crediting the country with almost completely stopping the transmission of the disease within its borders. But are these numbers real?
The Chinese government has a spotty record of accurately reporting numbers during a crisis. Is it possible that China is misreporting data now? Chinese President Xi Jinping has recently taken steps to increase his authority within China by removing term limits restricting his time in office. He has also taken a personal role in the policy response to COVID-19. If the central government proves unable to contain this disease, this would be a disaster for his presidency. So, his administration has a strong incentive to paint an unrealistically rosy picture. While China’s efforts may have slowed the disease, we should take the new case numbers coming from China with a big grain of salt.
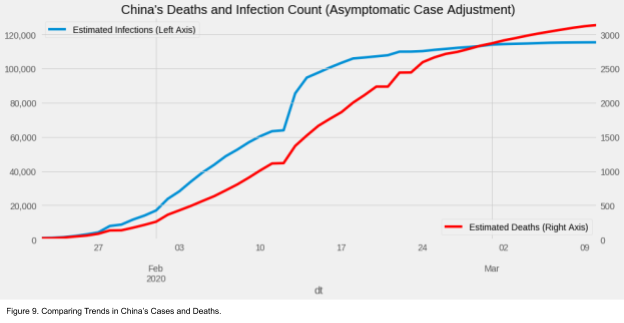
Early on in the crisis, China’s new case rate trend outpaced the trend in its death rate. Since the middle of February, that has reversed. China’s deaths are growing faster than its total case count. I believe this could be the result of China undercounting new infections, as those are easier to hide than deaths attributable to COVID-19. I hope I’m wrong about this. I leave it to the reader to draw their own conclusions.
Estimating the Impact of Detection Rates
We’ve already made an adjustment for the non-detection of asymptomatic cases. But, detection of symptomatic cases is unlikely to be 100%. This would result in further systematic undercounting, particularly in countries with no-to-low levels of outbreak detected. Public health officials are searching for a needle in a haystack when it comes to symptomatic cases. When it comes to asymptomatic cases, they are searching for a dull, hay-colored needle in a haystack.
An early study in China found that 81% of cases were “mild.” This same study found 1% of the reported/suspected cases were asymptomatic. If we believe both this study and our earlier estimate of the true asymptomatic rate, then a higher proportion of cases would qualify as mild or asymptomatic. We can estimate that the overall mild & asymptomatic rate after adjusting for unobserved asymptomatic cases would be 89.0%.
And, the remaining cases would be severe or critical. The overall severe and critical rate after adjusting for unobserved asymptomatic cases would be 11.0%.
If we apply this information to the US, we can estimate the likely size of the current infected population. We just need one more estimation: the detection rate.
For every 100 people infected with the virus:
-
**89 people **would likely not seek treatment unless they thought they were exposed to the virus. Furthermore, until late Feb, these patients would not even have been eligible for testing under CDC rules.
-
The remaining 11 people would go to a hospital. Of those 11, it was unlikely until recently that all 11 would even be tested for coronavirus. We can only guess at how many of these people would receive a test. For the purpose of this note, let’s assume 90% of these cases would be tested.
If these estimates are true, the US overall detection rate **would be **9.9%.
This finding leads us to the following conclusions: (as of March 10, 2020)
-
The reported number of current US cases is 910, excluding Diamond Princess and Wuhan cases.
-
The implied number of current US cases is 7,602.
-
The implied number of currently undetected and unmonitored US cases is 6,692.
-
The implied unresolved mortality rate in the US is 0.37%.
Estimating Current US Cases from Mortality Statistics
At the time of this writing, the US has 28 deaths from COVID-19. If we use the 0.4% mortality rate that we estimated in the previous section, we can attempt to validate our estimate of the true number of cumulative COVID-19 cases in the US.
COVID-19 does not kill instantaneously even in the worst cases. This means that the people who died from COVID-19 in the US were likely infected 1–3 weeks ago. (Incubation period of approximately 5 days plus hospital care period before death of 1–2 weeks.) This would make deaths a “lagging indicator” or in other words, it tells us something about where we were in the past. A 0.4% mortality rate would imply that, 10 days ago, the US had roughly 4,400 cases.
The best estimates for how quickly the novel coronavirus spreads also come from the Diamond Princess Cruise. This is known as the reproduction factor or the R0 *(pronounced R naught). The *R0 is the average number of people who get infected for each person who is infected. While the estimates for R0 vary significantly, the best estimates are around 2.3 with a serial interval of 5 days. In simpler terms, that means that the infected population roughly doubles every 5 days.
So, 5,600 cases 10 days ago would translate to roughly 22,400 cases today.
This estimate is much higher than our earlier estimate of 7,602 cases. We don’t know how to decide which is a better estimate. Thus, we adopt this as a range of likely current cases in the US.
COVID-19’s Spread and Impact
We can use basic assumptions about the reproduction/spread rate (R0) and the serial interval (SI) to estimate the magnitude of the spread in the US over the next few months. The best estimates I’ve found for these metrics come from a study based on the Diamond Princess cruise. See the Bibliography for lots of estimates of R0 and SI.
These two metrics essentially give us the rate of increase for our projection. Though the R0 can be reduced over time by competent government action (e.g. quarantines), improved hygiene (e.g., handwashing), and social distancing measures (e.g. less crowded subways, school closures, banning large gatherings).
I have based my model heavily on the SIR model, which traces its history back to the early 20th century. This model is a workhorse of epidemiology research.
How does the SIR model work?
It takes in a couple key parameters as inputs:
-
the R0 or reproduction factor that we discussed earlier,
-
the recovery rate (how quickly people get better).
The model calculate three numbers for every day:
-
Susceptible population — the number of people in the population who could catch the disease
-
Infected population — the number of people currently infected
-
Recovered population — the number of people who recovered from the virus and gained immunity + the number of deaths from the disease.
These three numbers are how the model gets its name. Starting on day 1, the model takes the SIR numbers from day 0 (today) and calculates:
-
how many people on day 1 will become sick (S → I)
-
how many people on day 1 will recover (I → R)
In this implementation of the SIR model, these two rates are calculated from the R0, SI, *and, *recovery rate found in research studies. We also split the recovered population in alive and immune and deaths, based on the mortality rate calculated earlier in this note.
BEFORE YOU LOOK AT THE MODEL OUTPUT
*This model is **not **meant to *precisely predict the date of peak illnesses nor is it meant to perfectly guess the number of deaths. There are much more sophisticated models out there put together by people who have formal training in epidemiology.
This model **is **meant to help us understand the scale of the crisis we are facing. Epidemics like COVID-19 roll out slowly at first and can accelerate more rapidly than we can keep up with. This model gives us a tool to get ahead of the virus and prepare for the scale of the crisis. Specifically, this note is meant to encourage policymakers to act more boldly to contain this virus and to explain to everyone else why they have to do that. As you will see, even a big error in the model would still result in a need for major actions by the government.
Model Projections
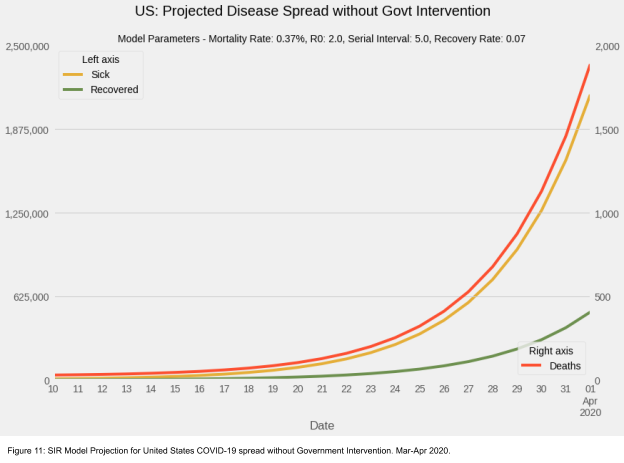
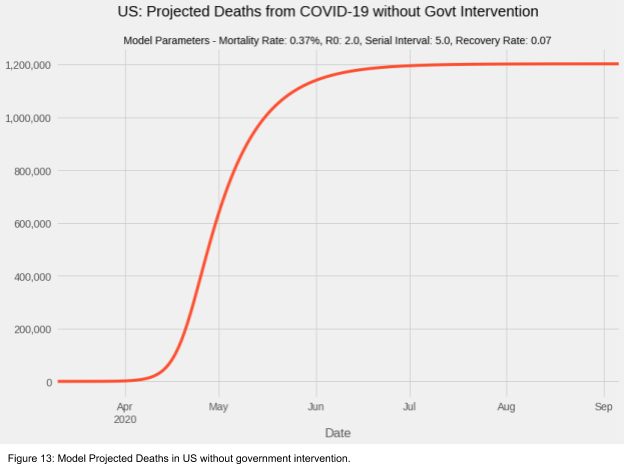
We start our forecast on March 10 with an estimated 7,602 cases and 28 deaths in the US. And, we end the month with 2 million cases and almost 2,000 deaths. While the infection rate grows quickly in March, it’s only when we zoom out to the summer and fall that the scale of the crisis becomes clear.
To reiterate an earlier point: this model forecast should not be taken as a hard and fast prediction of what will happen. This can be thought of as a possible scenario if the country does not take steps to limit the spread of the novel coronavirus. We can definitively take steps to reduce how quickly the disease spreads. The scale of this chart also distorts the significant death toll this virus could have on the country.
Discussion & FAQs
Even assuming a death rate that is roughly one fifth most current estimates, this model projects over 1 million deaths in the US in 2020 from COVID-19. Last year roughly 86,000 Americans died from the seasonal flu. In terms of likely death toll, The prospect of uncontrolled COVID-19 spread in the US is more than an order of magnitude (10x) more serious than the seasonal flu.
We should note that this mortality projection is almost certainly too low, if this scenario came to pass. WHY? As you can see in Figure 11, at its peak over 50 million Americans would fall ill in this scenario. Early we calculated an overall severe and critical rate of 11.0%. That would mean 5.5 million Americans would need hospitalization. According to the OECD, the US only has 2.77 beds per 1000 people or roughly 914,000 hospital beds (0.0027 beds per American * 330,000,000 Americans). We would be short by 4,600,000 beds. This would surely raise the mortality rate of this virus.
Bottom line: We have to slow down COVID-19.
Why does this seem to be more contagious than the flu?
Since I’m not a doctor or an epidemiologist, I’ll point you first to a more reputable source on this question. The NYTimes published a great article answering lots of questions about how COVID-19 compares to the season flu. I’ll attempt to summarize some key points here.
-
We have a vaccine for the flu. Even though the flu vaccine does not fully protect you from getting the flu, it significantly lowers your chances of getting it. Since the vaccine lowers your chances of getting the flu, it also lowers the chances for people who cannot or did not get the flu vaccine because you won’t give the flu to them. And then they won’t propogate the flu further. Since we don’t yet have a vaccine for COVID-19, this effect does not exist and increases the speed of transmission. Moreover, the earliest we can hope to have a widely distributable vaccine is in early to mid-2021.
-
**Many people have existing immunity to the flu. **Similar to the vaccine, you may have already had the seasonal flu floating around this year during a previous year. Your body’s antibodies can protect you from falling ill again. Luckily, you haven’t had COVID-19 before. Unluckily, that means you don’t have the right antibodies to fight it off (yet).
-
COVID-19 appears to be more contagious than the flu. COVID-19 has a reproduction factor (R0) of approximately 2.3 vs. the seasonal flu’s 1.3. This means that for every person who gets COVID-19, they will give it to 2.3 other people. The important insight here is that differences in these R0’s are exponential. Comparing flu to COVID-19 after just four rounds of transmission, COVID-19 is responsible for more than 4x as many infections as the seasonal flu.
What would happen if the virus has a seasonal pattern?
National Geographic interviewed people far smarter than me about whether COVID-19 will exhibit a seasonal pattern. This is a topic of heated disagreement among people who study coronaviruses. The tl;dr: is that many viruses in the same family as COVID-19 exhibit seasonal patterns, but not all do. We will have to wait and see what happens in this case to know.
It’s true that most cases reported so far have been in northern hemisphere countries with cooler late-winter weather. However, Iran has one of the worst outbreaks in the world and experiences weather similar to late spring in NYC around this time of year. (mid-60℉) Also, it should be noted that many of the countries with low levels of infections and deaths also have less developed public health systems and limited abilities to detect COVID-19 cases. This may be driving the lower reporting rate rather than warmer weather. It is not yet clear.
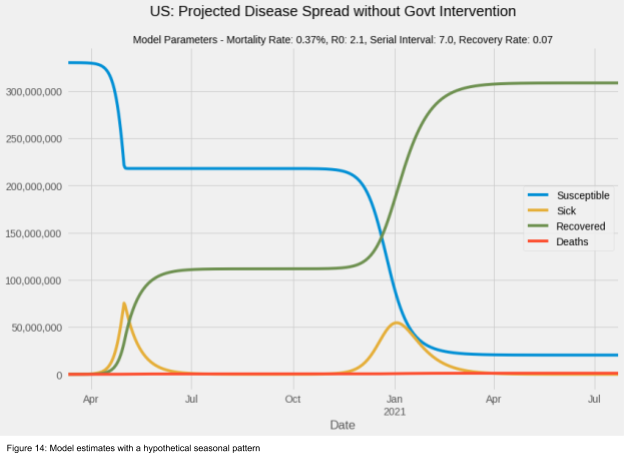
Let’s assume for a moment that COVID-19 exhibits seasonality and we have an unusually warm spring. We can model this as the R0 falling by 80% from 2.3 to 0.46.
While seasonality would undoubtedly be better than the alternative, it does not significantly lessen the threat that COVID-19 poses. Without significant work to limit the spread of the virus, this model shows us that even with seasonality, COVID-19 will make approximately a fifth of the population sick at two different times during 2020. And, with vaccines at least a year away, we cannot count on them to prevent the second rise in infections. With an approximately 10% severe case rate, that would mean 5–8 million people would need hospital beds first in the early spring then again in the fall. That would still require far more hospital beds than are currently available. In turn, we could expect the mortality rate to rise during those peaks of infectivity.
What happens if the R0 (or other parameters) are different than you think?
Scientists and epidemiologists are working hard to understand the basic epidemiological characteristics of COVID-19. I have tried to use the best research I can find to use in my models. However, we should expect future research to change the estimates for parameters like the R0 and the mortality rate, though it is unclear which direction those changes will push the estimates.
In order to account for this uncertainty, data scientists use a simulation-based modeling approach. We can run our models hundreds of times with different parameters and see how sensitive the models’ projections are to changes in key parameters. I have done a basic version of that simulation modeling and we can see a significant range of possible outcomes without government intervention.
(For those more technically inclined, the parameters for these models were drawn from various random distributions functions depending on the parameter’s characteristics. For example, the R0 values were drawn from a gamma distribution (α = 4.2, θ = 0.5), which has the properties of all values being greater than 0 and a mean of 2.3 as found in the research. The severe detection rate was drawn from a beta distribution (α = current US deaths, 22, β = 1), which has the nice property of being bounded by 0 and 1.)
SO WHAT?
The bottom line is that there is an incredibly high degree of uncertainty about how this disease would spread within the United States without government intervention. That being said, the uncertainty is bounded between very bad outcomes and horrible outcomes.
If we just look at the best case scenarios without government intervention: 5% of simulations have a peak infection date later than September 5, 2020. Of those simulations, they peak at an average of 23.6 million simultaneous infections. With a severity rate of 10%, that would mean 2.4 million Americans needing medical attention at once. Far outstripping our healthcare system’s ability to provide care.
This is pretty scary stuff! Why shouldn’t I panic?
Please remember several important caveats to these results:
-
I’m not an epidemiologist. I fully concede I could be wrong. (But if you know why/how I’m wrong please write me. I would like to understand.)
-
These models assume no government intervention and no changes in people’s behaviors. Changes to either of these will reduce the spread of the virus and spread out the impact on our healthcare system. That would allow hospitals and doctors to get patients in, treat them, and discharge them. Thus, making room for new patients.
-
Treatment. A set of promising antiviral drugs are in experimental trials right now. They could be ready before a vaccine and reduce the severity and mortality rates of COVID-19 until a vaccine is ready.
-
These models are exponential in nature. With all exponential forecasting models, small changes to the parameters can yield very large swings in the forecast. If we have overestimated a few of our parameters, the disease would spread more slowly and affect fewer people.
-
These are simple models. They treat the entire US as a single geography. While there is substantial domestic travel within the US, more sophisticated modeling approaches allow for variations in the spread rate depending on geography. This has the effect of slowing the spread of the virus even without government intervention.
-
Even with simulations, our estimates for how uncertain we are could be wrong. We may be oversampling parameters that result in very bad outcomes. Though, it is hard to know this now.
But…
There are also downside risks these models also don’t capture:
-
**Increasing mortality rates. **These models do not capture the dynamic that after a certain level of infected people is reached, the healthcare system is no longer able to provide services to meet the needs of the ill. This will significantly increase the severity and mortality rates of the disease. Indeed, there is evidence that this phenomenon happened in Wuhan, China and may be happening in northern Italy today.
-
**Reinfection. **This model assumes that once you recover from COVID-19, you won’t catch it again. There is good reason to believe that this assumption is sound as many other viruses exhibit those properties in people. Even the WHO holds this view. However, there are reports of COVID-19 reinfection raising this alarming spector. Though, these reports may be related to problems in differentiating between reinfections and the lingering traces of a previous infection.
-
Mutation. This virus, like so many others, has and will mutate. These mutations are generally not significant from an epidemiology perspective. However, there is always a chance that a mutation makes COVID-19 more (or less) contagious or severe.
How does the model do at predicting Italy?
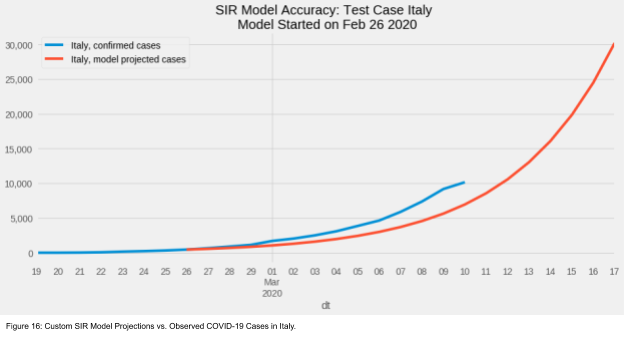
As you likely already know, Italy has embraced extreme measures to try and slow the spread of COVID-19 in response to the explosion of cases in Italy over the past two weeks. We can apply this model to reported cases in Italy from two weeks ago as a test for the model’s performance.
The model generally captured the trend of rapid disease expansion in Italy over the preceding two weeks. This should give us some confidence that the model is performing well enough. We should also expect (and hope) to see divergence from the model’s projections in Italy going forward, as their country-wide shut down and social distancing measures slow the virus’s progression. As a reminder, the model does not account for any government intervention.
Policy Implications & Economic Impact
Now that we know as much as we can about COVID-19 today, what can we do about it?
From a personal perspective, people should follow advice from public health officials. Things like: Wash your hands. Avoid shaking hands and touching your face. Stay at home when sick. Prepare your home like a big storm is coming and stock up on essential food and supplies.
From a policy perspective, there are some big and difficult decisions that have to be made. And they need to be made now. Every day that passes is a day of further spread, reduced productivity, and increased risk.
Option 1: Do the bare minimum [Status Quo]
This is roughly where we are today. Almost all schools, public transit, businesses, and normal life continue as normal. Many people seem blissfully unaware of the scale of disaster coming. So for these few days, life and business can continue as usual for most.
However, even now, we are beginning to see the economic consequences of COVID-19 emerge. People who work in events and travel are already losing their jobs or having their pay cut as vacationers and business cancel plans and avoid making new ones. Just like the coronavirus itself, these economic consequences will only accelerate over the coming weeks.
Policymakers must realize as soon as possible that Option 1 is not tenable.
If nothing is done, deaths will mount quickly in the US, possibly reaching into the thousands before April. Policymakers who think that business as usual will continue in this scenario have no business in government. Fear will grip society and a rudderless public will enact their own social distancing measures, while simultaneously losing trust in government institutions. They will rightly blame those same leaders and institutions for thousands of avoidable deaths.
Option 2: Adopt Chinese Italian Style Containment Strategy
When I started writing this note, there was only one country that had adopted unprecedented regional social distancing measures. That country was China. Now, Italy has adopted those measures nationwide. And New York Governor Andrew Cuomo is trying a scaled down version of that with the National Guard in New Rochelle.
Policymakers should accept that there are no good policy options. Choosing an Italian-style approach will hurt workers’ pay, keep children from school, damage economic output, and heavily disrupt daily life. But what’s the alternative? All of those things will happen in Option 1 as well, but with deeper and longer lasting effects.
If we pursue this option soon enough, it’s reasonable to expect, based on China’s example, that the virus spread could be slowed or even stopped within a month. Though, that will only be possible if we can ramp up testing for the virus throughout the entire population. The longer we wait the more the virus has spread and the longer it will take to stop.
Policymakers should act to implement Option 2 as soon as possible. Every day lost will take several more days in lock down to make up for.
Emergency Economic Support
This option must also come with other supplementary policies. My brilliant former colleague Claudia Sahm has already called for Congress to act on this as soon as possible. She has proposed:
-
Emergency Support for Healthcare Infrastructure
- **Immediate Financial Support For Workers and Families
- **Giving every American $500 per month during the crisis
-
Eliminating withholding taxes
- Fiscal Stimulus and Central Bank Support Support
Beyond these measures, policymakers should:
-
Extend and enhance the Family and Medical Leave Act (FMLA) to allow more workers to care for family members who fall ill to COVID-19;
-
Guarantee the extension of unemployment benefits for a longer period of time, as workers lose job opportunities;
-
Expand Medicare coverage for all ages, and
-
Require that any out-of-pocket fees relating to COVID-19 testing be waived for those with insurance plans. And, guarantee Federal payment for those without insurance.
These steps are essential to minimize what is shaping up to be one of the biggest economic downturns and humanitarian crises in our lifetimes.
Thank you for reading this note. I hope this spurs you to action and helps you feel more prepared. All views and errors are my own. Many thanks to my friends and family for their support, feedback, and insights as I put this note together.
Bibliography
-
Clinical Characteristics: https://www.nejm.org/doi/full/10.1056/NEJMoa2002032?query=RP#.Xlld6SAJrQQ.twitter
-
Epidemiological Characteristics: http://weekly.chinacdc.cn/en/article/id/e53946e2-c6c4-41e9-9a9b-fea8db1a8f51
-
Urban spread model: https://lexparsimon.github.io/coronavirus/
Reproduction Rate and Serial Interval Estimates:
- Steven Sanche, et al., “The Novel Coronavirus, 2019-nCoV, is Highly Contagious and More Infectious Than Initially Estimated,” 11 Feb 2020, https://www.medrxiv.org/content/10.1101/2020.02.07.20021154v1
-
R0: 4.7 and 6.6
- Chong You; et al., “Estimation of the Time-Varying Reproduction Number of COVID-19 Outbreak in China,” 19 Feb 2020, https://papers.ssrn.com/sol3/papers.cfm?abstract_id=3539694
- Basic R0: 3–5.4
- Controlled R0: 1.1–1.8
-
SI: 4.27 days +/- 3.44d
- Hiroshi Nishiura et al., “Serial interval of novel coronavirus (2019-nCoV) infections,” 17 Feb 2020, https://www.medrxiv.org/content/10.1101/2020.02.03.20019497v2
- SI: 4.0–4.6 days
- Other key finding: SI likely to be shorter than incubation period, suggesting infected persons can spread disease before showing symptoms.
-
n=28
- Sheng Zhang, et al. “Estimation of the reproductive number of Novel Coronavirus (COVID-19) and the probable outbreak size on the Diamond Princess cruise ship: A data-driven analysis,” 22 Feb 2020, https://www.sciencedirect.com/science/article/pii/S1201971220300916
- R0: 2.28 (2.06–2.52)
-
SI (assumed from another study): 7.5 d
- Kenji Mizumoto, Gerardo Chowell, “Transmission potential of the novel coronavirus (COVID-19) onboard the Diamond Princess Cruises Ship, 2020” 28 Feb 2020, https://www.medrxiv.org/content/10.1101/2020.02.24.20027649v2
- Basic R0: 5.8 (95%CrI: 0.6–11.0)
- Uncontrolled, confined R0: 11.2
- Full Quarantine R0: 0.35
-
Asymptomatic ratios by age: 30.8% (ages 20–59)
- Zhanwei Du, “The serial interval of COVID-19 from publicly reported confirmed cases,” 23 Feb 2020, https://www.medrxiv.org/content/10.1101/2020.02.19.20025452v1
- SI: 3.66–4.06 (Mean 3.96 days)
- SI is time varying and dependent on control measures
- R0: 1.33
-
“12.1% of reports indicating pre-symptomatic transmission”
- Juanjuan Zhang, et al. “Evolving epidemiology of novel coronavirus diseases 2019 and possible interruption of local transmission outside Hubei Province in China: a descriptive and modeling study” 23 Feb 2020, https://www.medrxiv.org/content/10.1101/2020.02.21.20026328v1
- “The mean incubation period was estimated at 5.2 days (1.8–12.4)”
- Mean SI: 5.1 days (1.3–11.6)
-
“We estimate that the epidemic was self-sustained for less than three weeks with Rt reaching peaks between 1.40 (1.04–1.85) in Shenzhen City of Guangdong Province and 2.17 (1.69–2.76) in Shandong Province. In all the analyzed locations (n=10) Rt was estimated to be below the epidemic threshold since the end of January.”
- Kenji Mizumoto, et al. “Estimating the Asymptomatic Ratio of 2019 Novel Coronavirus onboard the Princess Cruises Ship, 2020” 06 Mar 2020, https://www.medrxiv.org/content/10.1101/2020.02.20.20025866v2
- Asymptomatic ratio: 17.9%
-
Version 1 of this paper put the asymptomatic ratio at 34.6%.
- Shi Zhao, et al., “Estimating the serial interval of the novel coronavirus disease (COVID-19): A statistical analysis using the public data in Hong Kong from January 16 to February 15, 2020” 25 Feb 2020, https://www.medrxiv.org/content/10.1101/2020.02.21.20026559v1
-
Mean SI: SI at 4.4 days (95%CI: 2.9−6.7)
- Shi Zhao, et al., “Epidemic Growth and Reproduction Number for the Novel Coronavirus Disease (COVID-19) Outbreak on the Diamond Princess Cruise Ship from January 20 to February 19, 2020: A Preliminary Data-Driven Analysis” 24 Feb 2020, https://papers.ssrn.com/sol3/papers.cfm?abstract_id=3543150
- R0: 2.1 (with a SI of 4 days)
Data Sources
-
JHU’s famous arcgis map: https://gisanddata.maps.arcgis.com/apps/opsdashboard/index.html#/bda7594740fd40299423467b48e9ecf6
-
Data underlying map: https://github.com/CSSEGISandData/COVID-19
-
Chinese language charts: https://coronavirus.1point3acres.com/?from=timeline&isappinstalled=0
-
Current NYC testing: https://www1.nyc.gov/site/doh/health/health-topics/coronavirus.page
-
Mutation Dashboard : https://nextstrain.org/ncov


