How to Understand NYC’s Numbers In Real-Time
30 March 2020
Originally posted on medium.com
Tl;dr:
If the New York lockdown (called: “NYS on PAUSE”) has been effective at reversing the exponential growth of the novel coronavirus, be on the lookout for net new hospitalizations to shrink down close to zero by the end of the first week of April. But, beware of potential new biases in the hospitalization data.

Did it work?
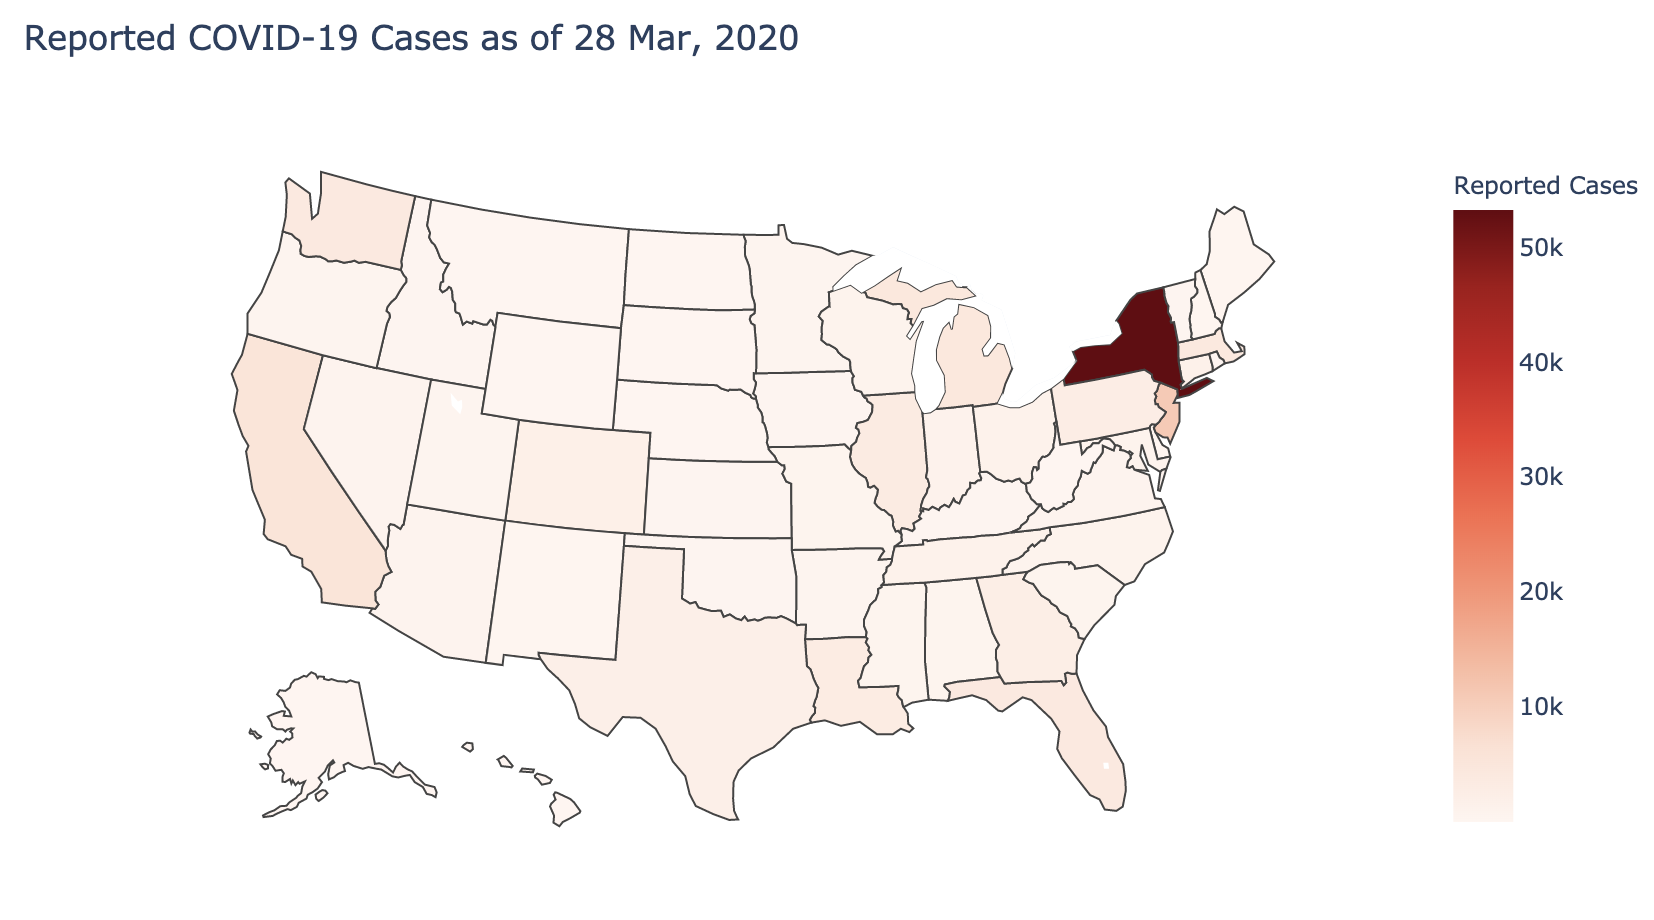
New York remains the epicenter of the COVID-19 crisis in the United States. Starting a week ago, Sunday, March 22 at 8pm, Governor Andrew Cuomo took the extraordinary step of putting the state “on PAUSE.” The question we all want to know is: did it work?
The first place to look for a reliable answer to this question is reported hospitalized cases. There are three main reasons that we use this metric:
-
**We test most patients who present with COVID-19-like symptoms. **This means that we get capture close to 100% of hospitalized cases. Previous estimates of the detection rate for all cases in New York State have varied from 3% to 9% over the course of just one week. Meaning rapid increases in reported case numbers may be attributable to more tests OR more infections.
-
**The percentage of cases who show up is constant over time. **While we don’t know the exact proportion of COVID-19 cases that require hospitalization, most reputable estimates range from about 5% to about 15%. More importantly than the level of the estimate, is that this proportion does not change over time within a given population. As a result, unlike with reported case data that can be affected by testing rates, we can infer the true changes in the spread of the virus using hospitalization data.
-
**The length of time from infection to hospitalization is relatively predictable. **If someone happens to be among the unfortunate minority of cases that develop severe symptoms from the novel coronavirus, the symptoms tend to force them to go to a hospital on average about 8 days after exposure. While everyone is different, on average this delay also stays the same over time. And, it means we know when to start looking for evidence that policies like the “PAUSE” are working.

Where are we today?
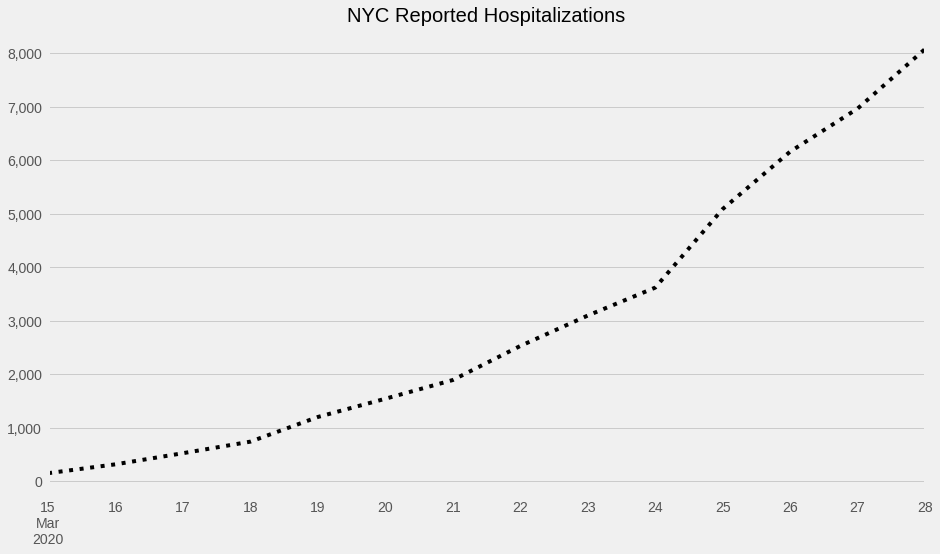
The NYC trend in hospitalizations during March has shown that exponential growth pattern that has been so broadly discussed about the coronavirus pandemic. The somewhat good news is that the trend over the last four days has been closer to linear than *exponential, *averaging at about 1,115 net new hospitalizations per day.
This is far more than we should ever ask of our emergency services, doctors, nurses, hospitals, and healthcare system. Numerous media stories and personal testimonials describe the pain and suffering of patients as we stretch our hospitals past capacity. Indeed, we have long since passed the estimates of available beds I included in my previous post (3,000). The only reason we still have new patients receiving care is because of incredibly hard and sometimes dangerous work by medical professionals and other first responders. Though, this could have been avoided with earlier actions.
Where are we going?

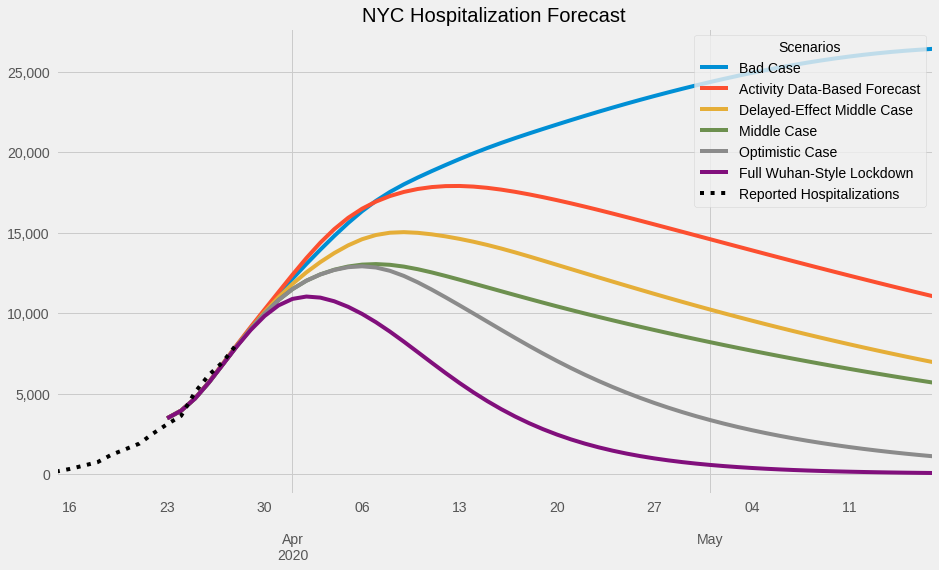
All of these forecasts agree that we can expect this trend to roughly continue in the range of 800–1,100 net new hospitalizations per day through the next 2–3 days. [Note: Net new hospitalizations refers to the change in the total number of hospitalized COVID-19 patients from day to day.]
Our optimistic scenario forecast predicts that *net **new **hospitalizations *will drop below 700 per day starting on April 1. Then, quickly dropping to zero over the next week, so by the beginning of the second week of April we will hit a peak caseload of about 13,000 cases hospitalized simultaneously. (This would indicate a broadly successful effort to bring the reproduction factor below 1.0 after the implementation of the NYS on PAUSE policy, thus suggesting a rapid decrease in overall infections in the city.)
For reference, the chart includes a forecast that uses estimates for the reproduction rate from the Wuhan lockdown period. It seems unlikely that the current PAUSE will be as effective as China’s severe policy in Hubei province. This chart helps us understand what the difference might be. We don’t currently have any evidence about the effectiveness of the PAUSE due to the lag discussed above. Since real data can be noisy, we will have to wait for several days of favorable numbers before we can have any confidence in the trend.
If the PAUSE did not work at bringing the reproduction factor below 1.0, we would be looking at something like the “Bad Case” Scenario on the forecast chart. We would expect to see net new hospitalizations averaging around or above 1,000 through most of the week and staying above 500 through next weekend. Average daily returns much higher than this range over several days should be cause for alarm.
This would suggest that the virus is still spreading in NY exponentially. If left unchecked under this scenario, we would not see a peak hospital load until May or later. And the peak load could exceed 40,000 or more. Even if these numbers came to pass over the next week, it’s unlikely that the Governor would allow the state to continue along a path that would result in such a grim outcome. Instead, we should expect greater testing, enforcement, and restrictions to improve the efficacy of the PAUSE.
One Last Word Of Caution: Bias
New biases may be entering into the hospitalization data over the coming days that would result in underestimating hospitalization levels. You could imagine that a variety of sources could cause this problem, including:
-
Hospitals at capacity turning away severe cases.
-
EMS crews being overwhelmed or losing capacity to transport cases due to infections of crew members.
-
Hospital staff not testing COVID-19 positive patients and thus not reporting them due to triage procedures that prioritizes care over reporting.
We should treat all data coming in over this week as potentially subject to these downward biases. Though, an upward bias is possible if hospitals are freed up to do more complete testing in the coming week due to more support from emergency staffing (FEMA, National Guard, retired medical volunteers). While possible, it would seem the more likely bias is to depress the true number of hospitalizations.
As a result, it will be difficult to conclude decisively over the coming week **that the PAUSE did enough **to bring down the reproduction factor below 1.0.
On the other hand, if new daily hospitalizations come in well above our expectations, we would be forced to conclude that we need additional steps to suppress further spread of the novel coronavirus.
While these biases will make the next few days difficult to interpret, we can improve our confidence in the data by:
-
Seeking out qualitative evidence about the remaining capacity of hospitals;
-
Get updates on the on-the-ground practice of testing and reporting of patients with COVID-like symptoms;
-
Look for news about the ability of EMS crews to keep up with the demand for transportation to hospitals.
This will be a difficult and scary week in the city’s history. Medical professionals and first responders will be on the front lines of the crisis, but public cooperation with social distancing measures and good data-driven policy can help turn the tide against this pandemic.
